Article - Effectiveness of Workforce Analytics


Over the last few years Workforce Metrics and HR Dashboards have been the growth HR Technology Initiative.  This heightened interest in Workforce Metrics has seen a raft of new solutions and vendors specialising in Workforce Analytics and Dashboards launched on the market.  The race has also been on for existing HRIS Solution providers to deliver HR Dashboards and Workforce Analytics as new offerings for their products.

Why this apparent sudden interest in Workforce Analytics? One of the key drivers without doubt has to be the Global Economic Crisis with businesses putting increased demands on all functions to deliver information on the effectiveness of their respective operations.

For many functions this didn’t present a significant challenge as detailed Analytics had always been a key element of their existing business practice.  Sales and Marketing are well versed in the use of detailed Market Data and Analysis to track Market Share and the performance of various product lines and the sales force.  Finance is built on formulating budgets and tracking against actuals, identifying and investigating anomalies.  Manufacturing relies on historical trends and sales projections to create production schedules and determine inventory levels.  All these functions have long established roles dedicated to the analysis of information from both their operational systems and external market data.

With Workforce Analytics still in its infancy many HR and Payroll Departments were ill prepared for the sudden need for the detailed Analysis and Reporting on Workforce costs and associated activities.

Fortunately, another Technology initiative had been evolving for a number of years which was in the domain of Business Intelligence solutions.  The initial focus of BI Solutions was to deliver more intuitive and dynamic analysis for Financial and Operational functions. Consequently most BI initiatives were implemented alongside existing Financial and ERP Systems.  The upside for HR is that the BI design principals are transferable to HRIS solutions.  The major hurdle unfortunately is that BI solutions do not come cheap in either licence fees or cost of implementation.  Another complication was a lack of standardised BI Schemas for Workforce Data or Metric definitions.

The challenge for HR now is defining the value proposition and building a business case for the implementation of a HR focused Workforce Metrics solution.  Speaking to a number of HR Directors and Managers there is a general acceptance that the quality of their Reporting is inadequate and that there is a strong desire to bring about an improvement in the quality and method of delivery.

Whilst there is this new found appetite for Workforce Dashboards and Reporting there has always been a strong case for a Workforce Analytic and Dashboard solution as an effective tool for an organisation, it was just a case of education, technology and demand.
Some of New Zealand’s leading organisations have adopted Workforce Metric Reporting and Dashboard solutions over the last few years. Of specific interest has been the speed with which these solutions have been embraced.  Questions such as the number of Staff with excessive Annual Leave entitlements, departments working excessive Overtime, number of FTE’s paid for the Month, ratio of Overtime to Worked Hours, Sickness ratios and Annual Attrition rates are being answer instantly without relying on either Payroll or HR directly for the information.
What actually differentiates Workforce Metrics from standard Payroll and HR Reporting is that it will be built upon a Data Warehouse.  This Data mart will provide a raft of alternative dissections and reportable elements. No longer are Attrition Statistics limited to Organisational layers, but able to be analysed by Salary Ranges, Age Bands and even Performance ratings. It will also be able to draw together information from a range of proprietary systems so Reporting can go beyond that of the HRIS System.

The spectrum that Workforce Metrics can cover is limitless which for any company heading down the path of Workforce Metrics presents the first challenge, where to start?  The easy answer is to do what everyone else is doing, the ‘Lemming Effect’. This may not be the most beneficial or cost effective path to take. With Workforce Metrics there is no simple ‘Best Practice’ as all organisations are different, especially the issues that impact them.  The issues facing a Professional Services company are vastly different to those facing a Manufacturer.

So where to start? Identify the audience for the Workforce Metric and Dashboard solution.  Is the audience going to be interested in the detail or do they simply want Key Performance Results.  Will they have any interest in detailed and intuitive reporting or analysis?  This will provide a guide for the presentation and User Interface requirements.

The next step is identifying the key Metrics to be delivered. There will always be the common Metrics such as Staff Attrition, Leave Liability, Absenteeism, Labour Cost to Revenue.

The more specific Metric requirements will be determined by the type of workforce employed, as a Manufacturer will be impacted directly or indirectly by National Unions and Collective Agreements, more so than a Professional Services provider where most staff will be on individual contracts.  Manufacturers will derive more value from Labour Utilisation Metrics (such as Overtime Ratio’s, Casual/Temp utilisation) whereas a Professional Services company will benefit more from Talent Pool and Retention Metrics.

Existing Month End or Board Reporting can provide a good starting point.  All that may be required is to apply some Target Values to Key results already being reported.
When looking at deploying Workforce Metrics, don’t settle on the ‘One Size’ model, consider each potential audience type, and provide alternative delivery methods.  The Executive may require a simple Dashboard style view provided at month end, whereas Functional Managers may require a more Detailed Reporting Framework with a higher level of interrogation.  If multiple methods of delivery are used, every effort should be made to use a single source of information.  This ensures that all audiences are using the same base information and receiving consistent results.

When initially looking to introduce a Workforce Metrics Reporting solution, start with a simple Model based on information that is readily available and recognisable which can be provided in a timely fashion.  As the Workforce Metrics solution gains acceptance additional Metrics can be identified and the solution progressively grown.

All Metrics are going to provide valuable insights into the performance when used as a single snapshot, but the ability to trend that Metric will deliver added value.  Trending will identify whether a result is a reoccurring event, or is an improving or worsening trend.  Trended information can also be used to track the impact of business initiatives.  A simple example would be the tracking the average Leave Entitlement from Month to Month to identify if Entitlement Balances are trending down following an initiative to reduce the Companies’ Leave Provision.

Some answers may not come simply and it may require a number of Metrics to get a better picture of a particular issue. This has been encountered in the past when an anomaly was found where there was a Low Attrition %age but the Average Service Length for leavers was also low. Using other Metrics including Staff Demographic and Aging Workforce Metrics it highlighted what appeared to be a ‘protective’ culture as the Average Service Length of the incumbents was high along with the Average Age. This difficulty for new starters to settle along with an aging workforce issue exposed a potentially high risk for that operational area in the future where a significant amount of knowledge and skill would be lost over a relatively short period of time through retirement.

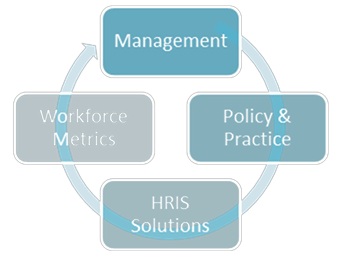
Ultimately Metrics are the indicators which bring to the attention of the business areas of concern. Whilst the Metrics in conjunction with the range of data elements help highlight the specific areas, they don’t provide the answers. Workforce Metrics provide the information for interpretation. From the interpretation, qualified decisions can be made on how to adapt policy and practice to drive change. From there, Workforce Metrics can track the impact of the change.

The journey may not be an easy one but the reward is well worth the effort.